 |
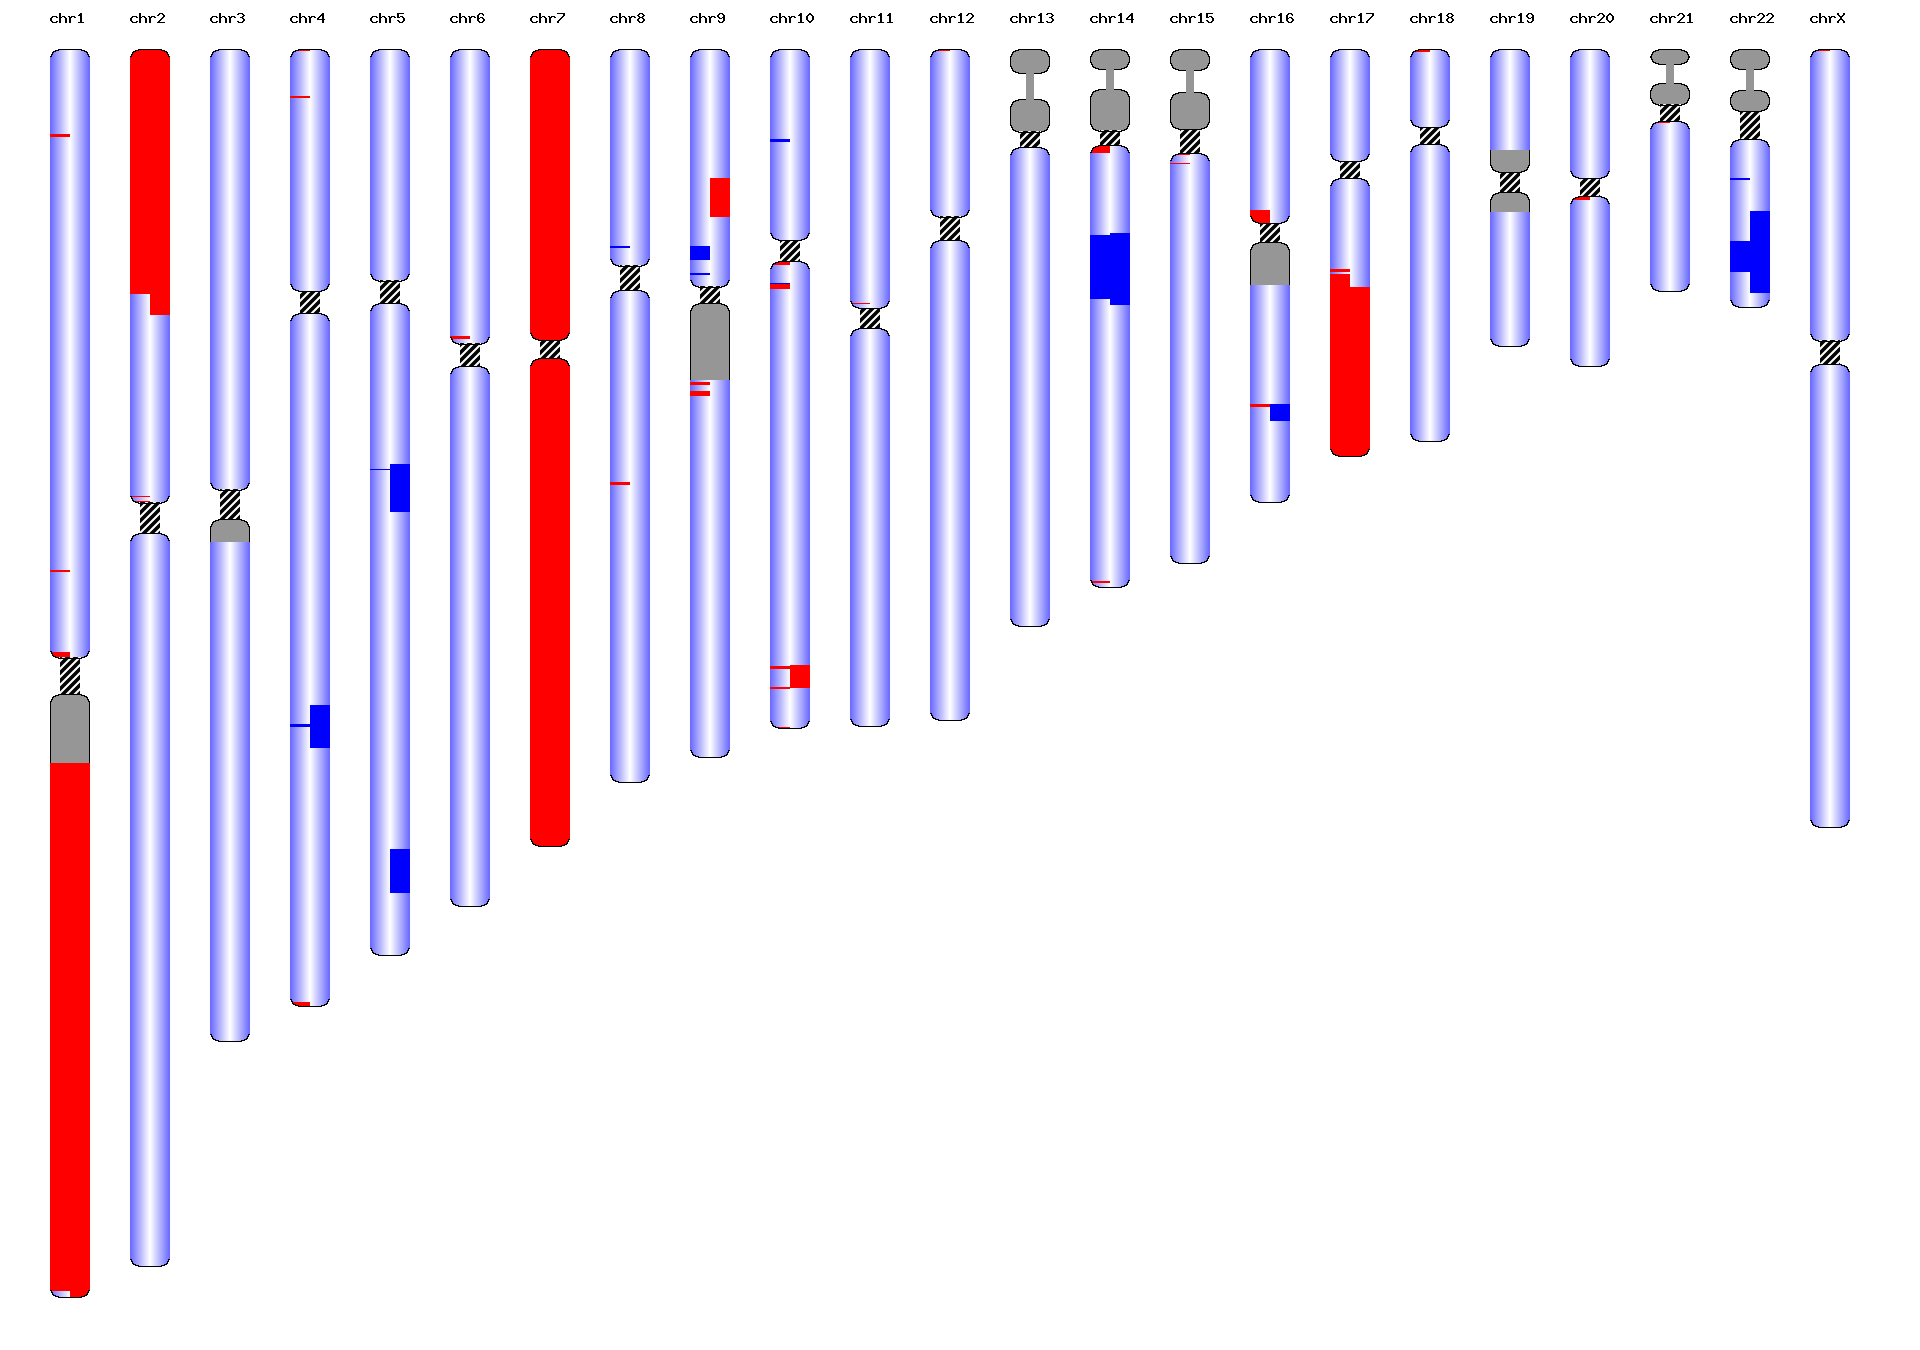 |
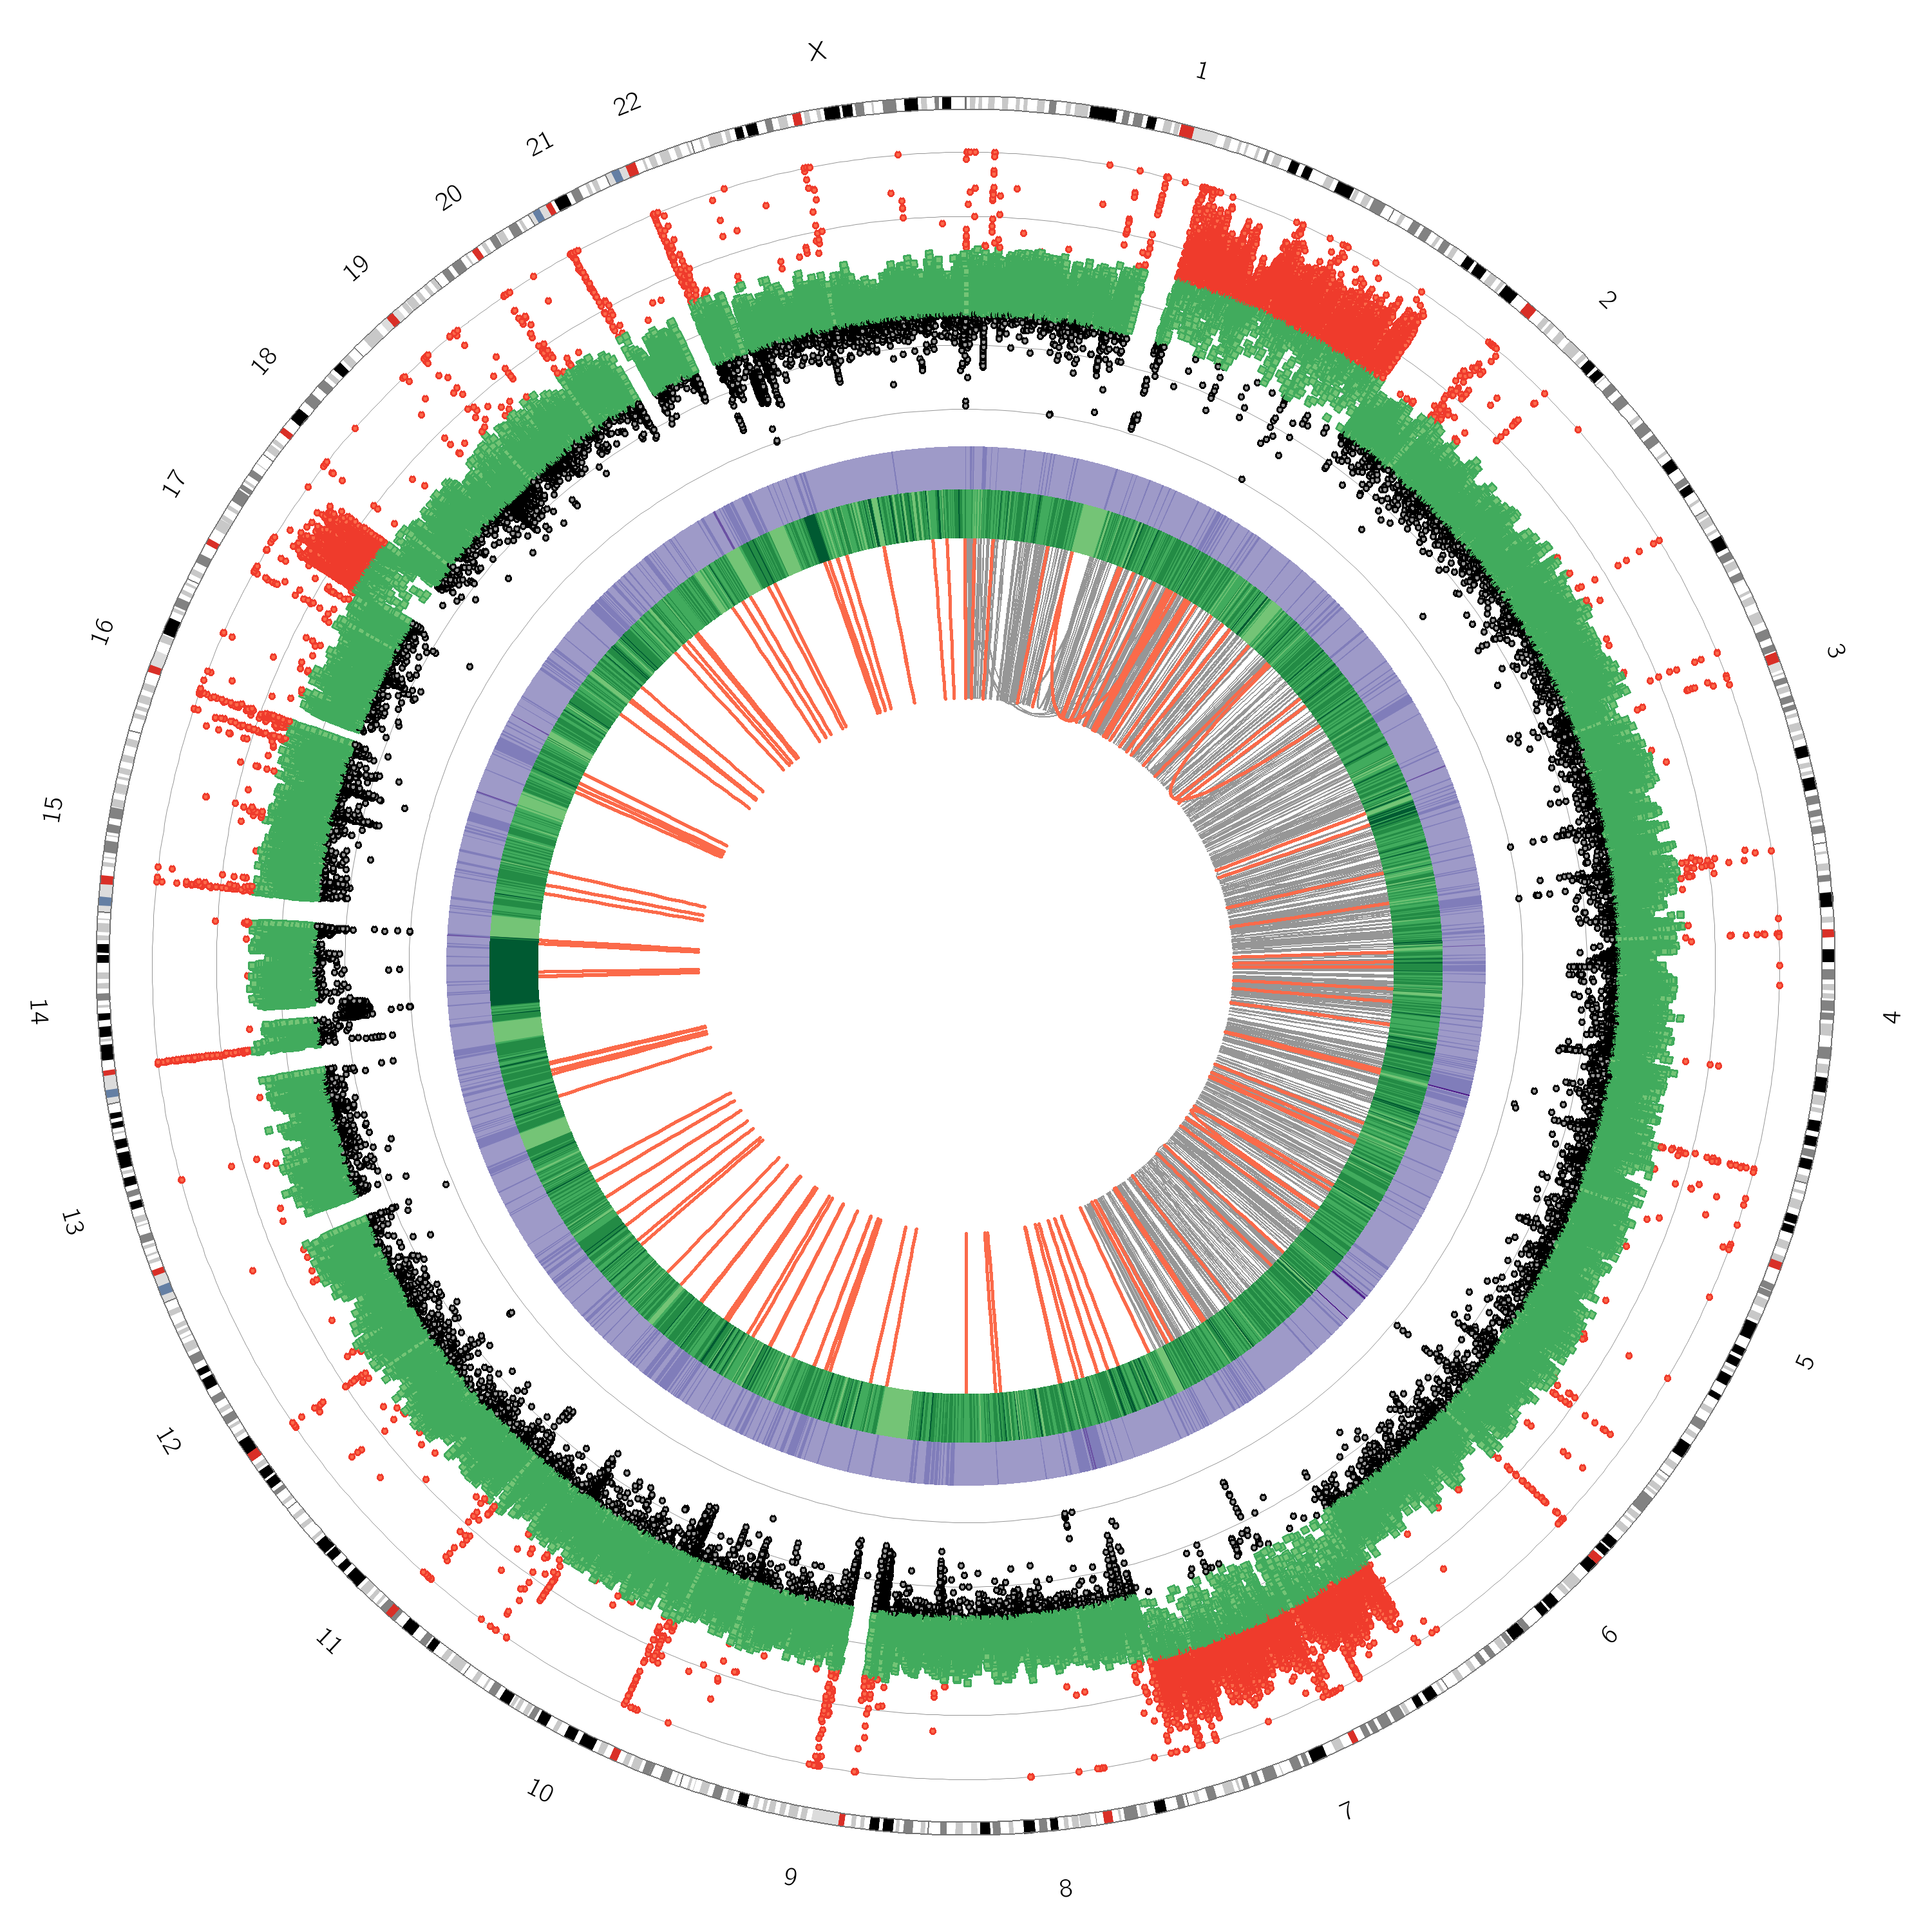
| Figure 1: Circos plot of the SH-SY5Y genome. Tracks represent (from outside to inside) karyotype for each chromosome, copy number variation (red > 2, green = 2, black < 2), density of small variants (bin size = 1Mb), homozygous small variant percentage (bin size = 1 Mb). Arcs represent chromosomal breakpoints (red = rare breakpoints not found in Complete Genomics Baseline dataset). | Figure 2: Copy number variation events detected by CG (left half of chromosomes) and microarray analysis(right half). Regions are highlighted for copy number gain (red) and loss (blue). The major events partial trisomy of chromosome 1 and 2, complete trisomy of chromosome 7, gain in 17q and loss in 22q were confirmed. |